Brownfield Opportunities
Case study · Infrastructure
Explore contaminated-site records with separate Grid, Fiber, Water, Land and Logistics findings, environmental screens and siting views. Nearby infrastructure does not prove service, capacity or availability.
- What
- Explore contaminated-site records with separate Grid, Fiber, Water, Land and Logistics findings, environmental screens and siting views. Nearby infrastructure does not prove service, capacity or availability.
- Stack
- Python data pipeline; static HTML, JavaScript and Leaflet.
- Status
- LIVE
- Dates
- Scope reviewed October 2, 2026; data dates shown in the app
- Links
- Live site · Source code
Background
Which site records support a redevelopment decision, and what remains unknown?
Federal contaminated-site catalogs identify places worth investigating. They do not establish parcel ownership, availability, grid capacity or water rights. Brownfield Opportunities makes those distinctions visible before a reader starts comparing sites.
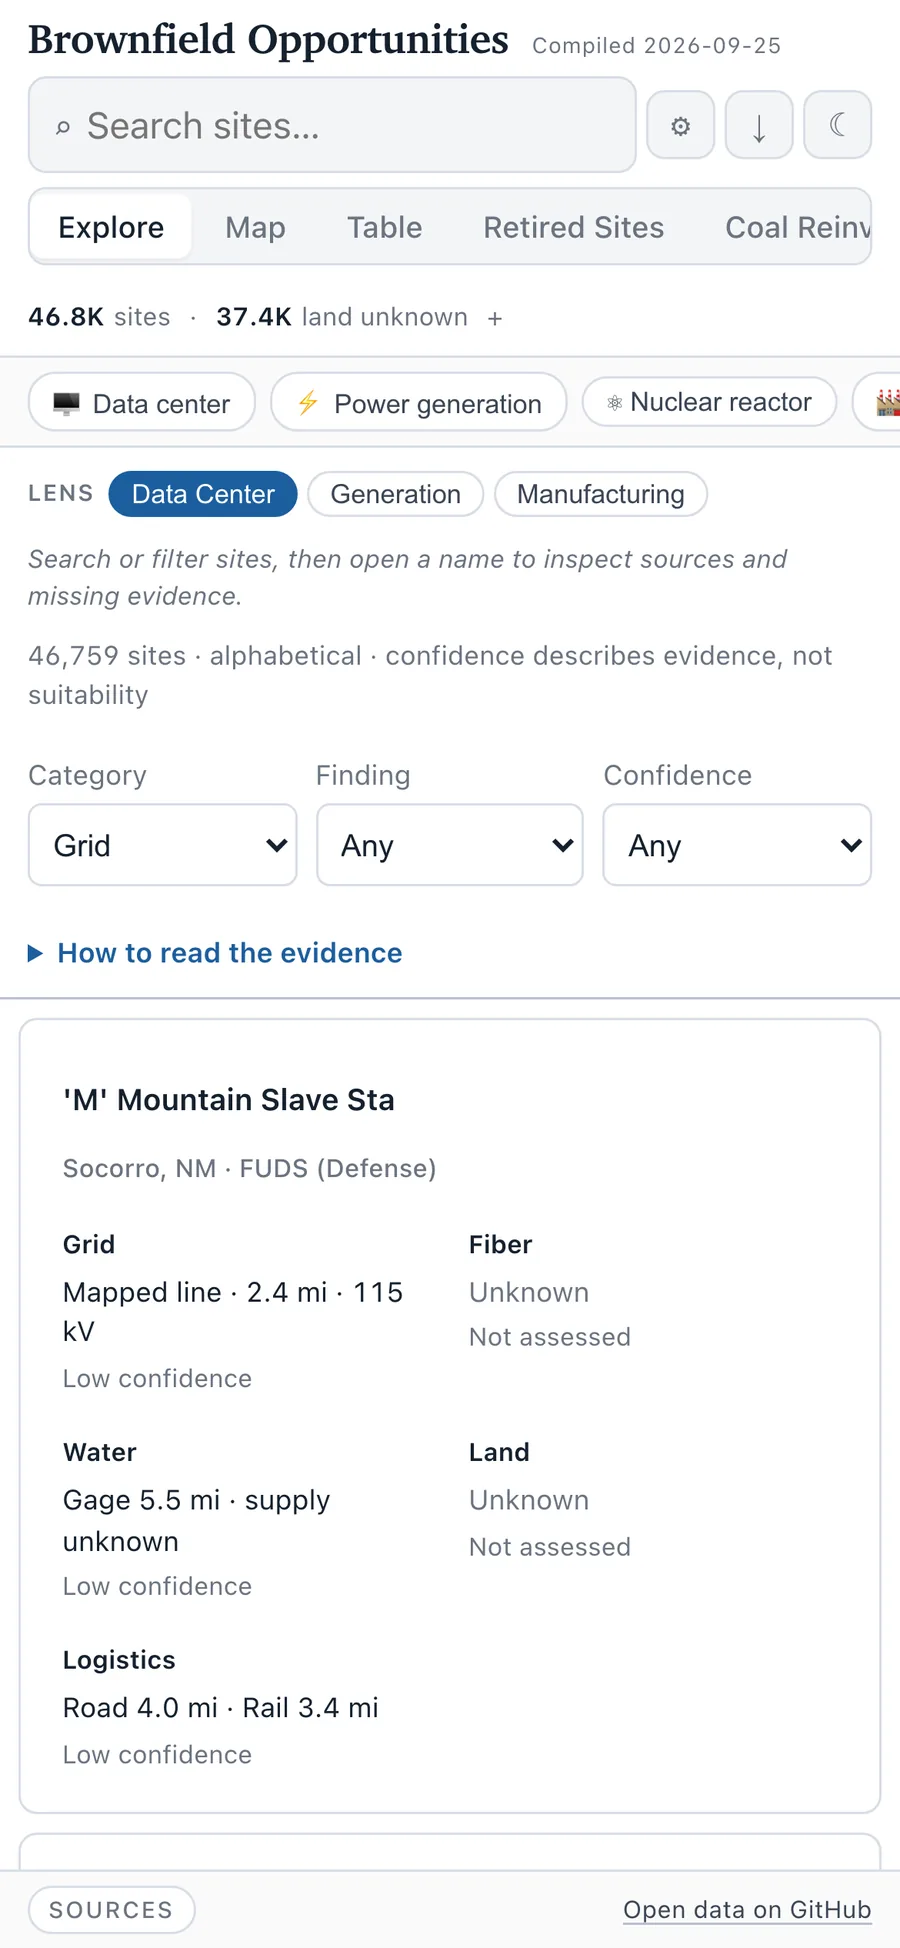
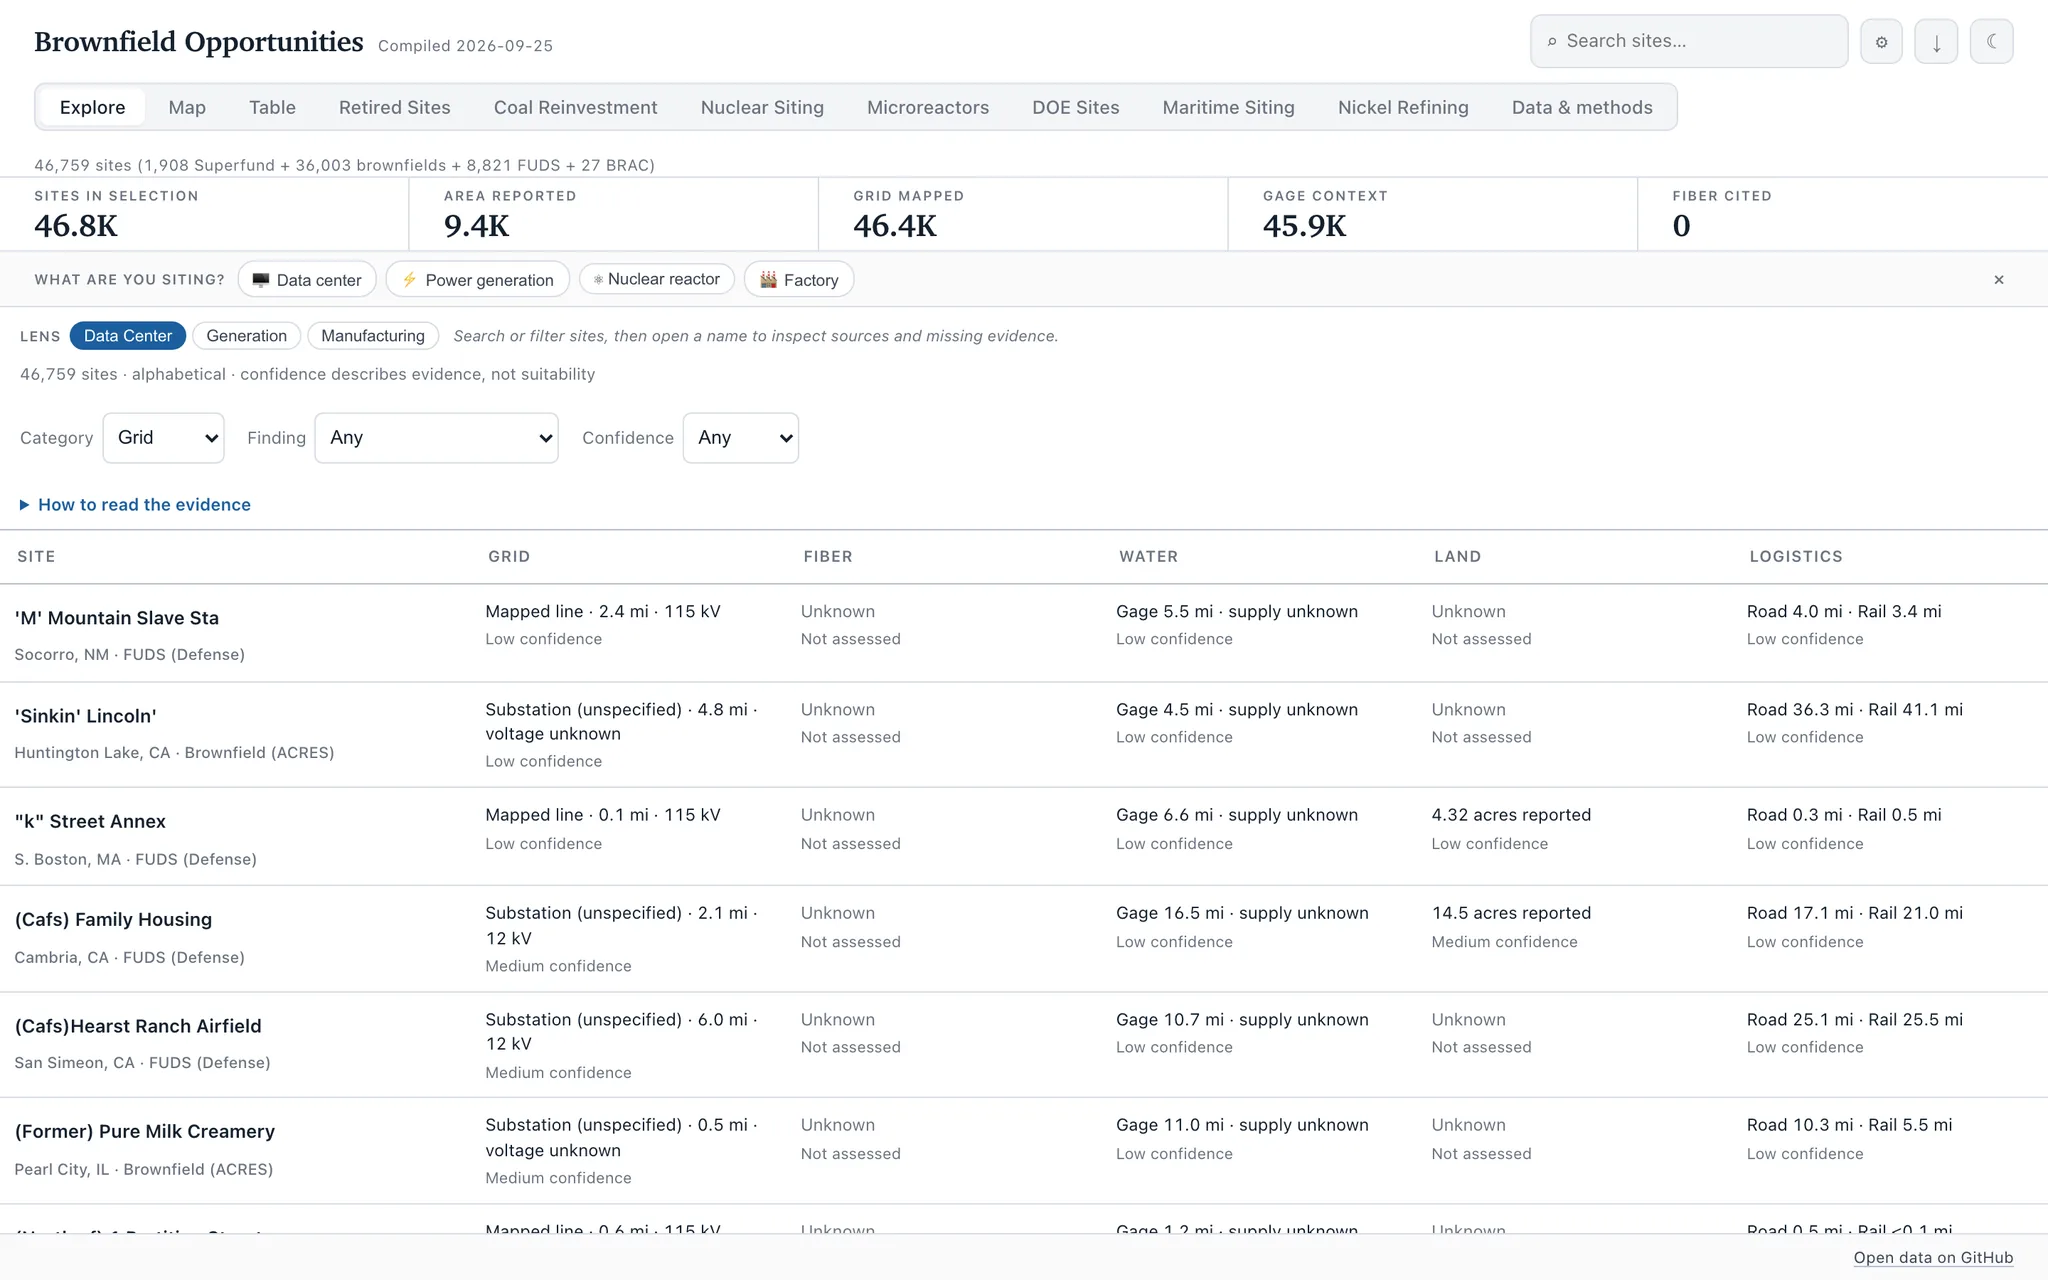
Explore now shows separate Grid, Fiber, Water, Land and Logistics findings. The map and specialized siting views add context for data centers, generation, manufacturing, nuclear, maritime uses and nickel refining.
A Look Inside
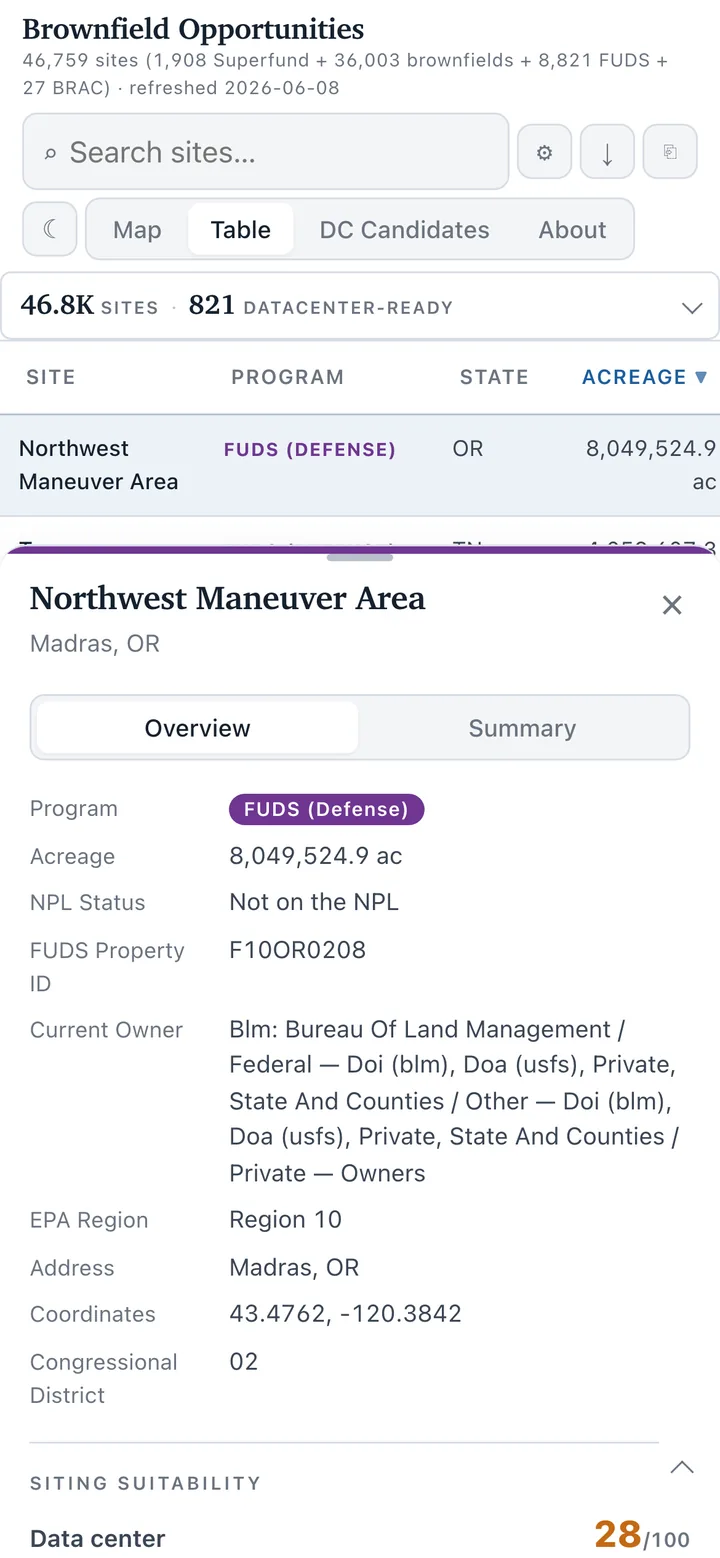
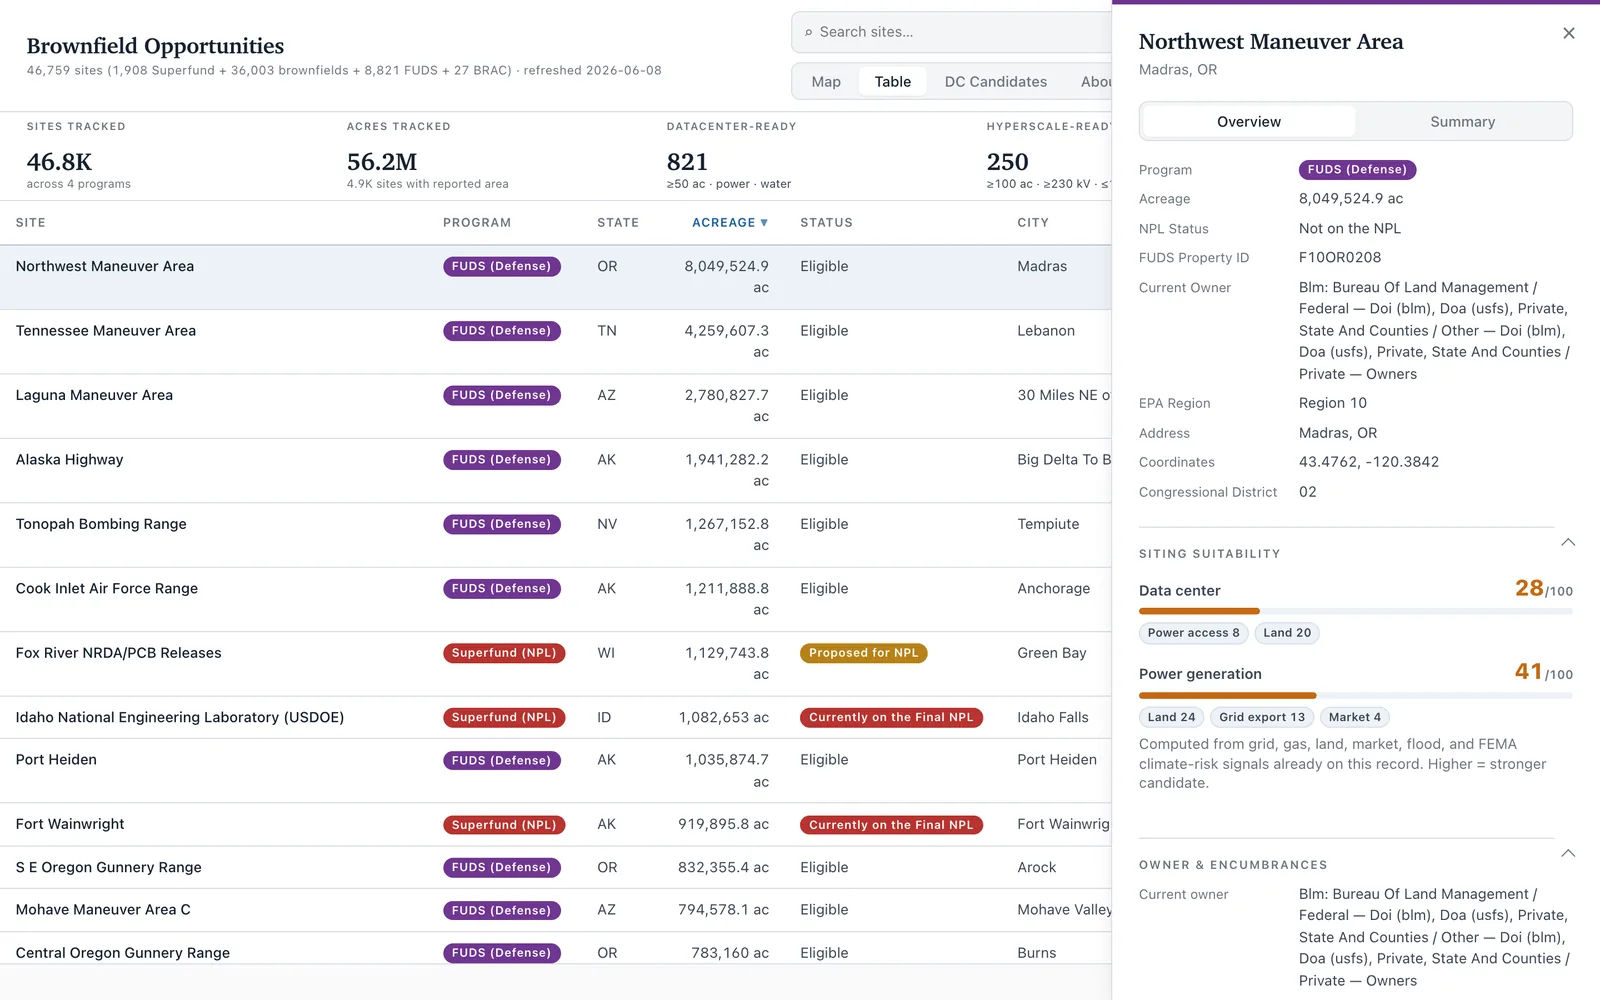
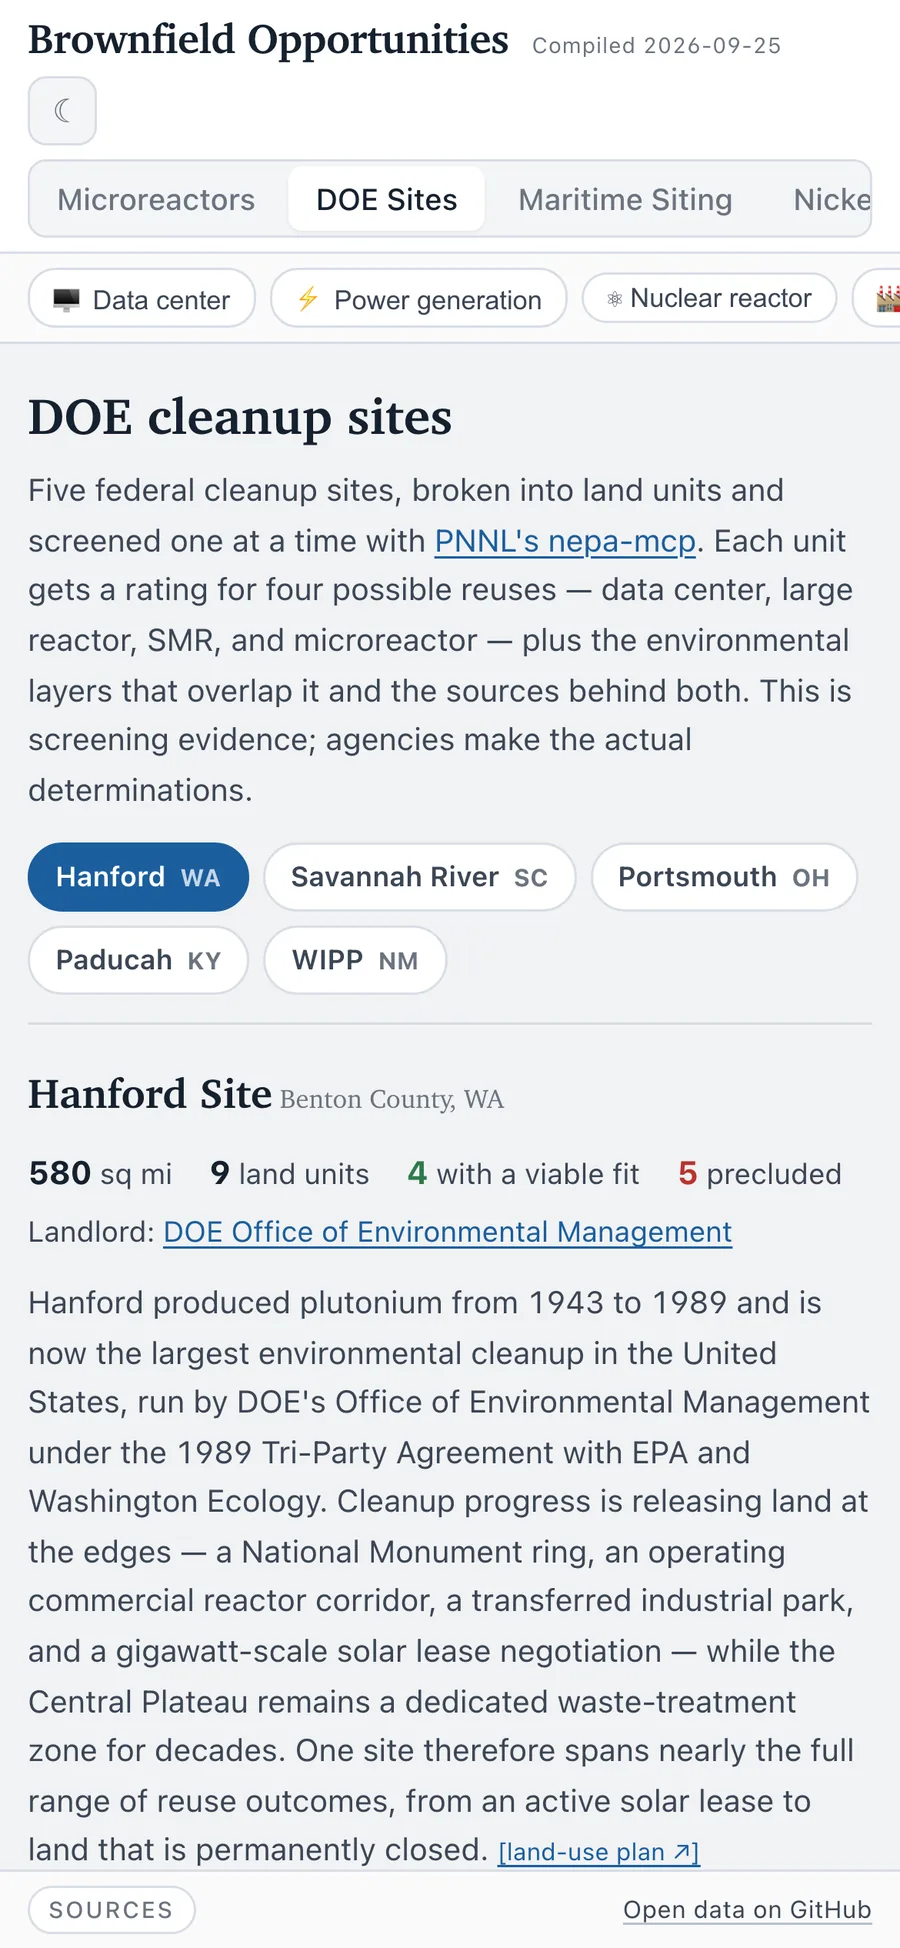
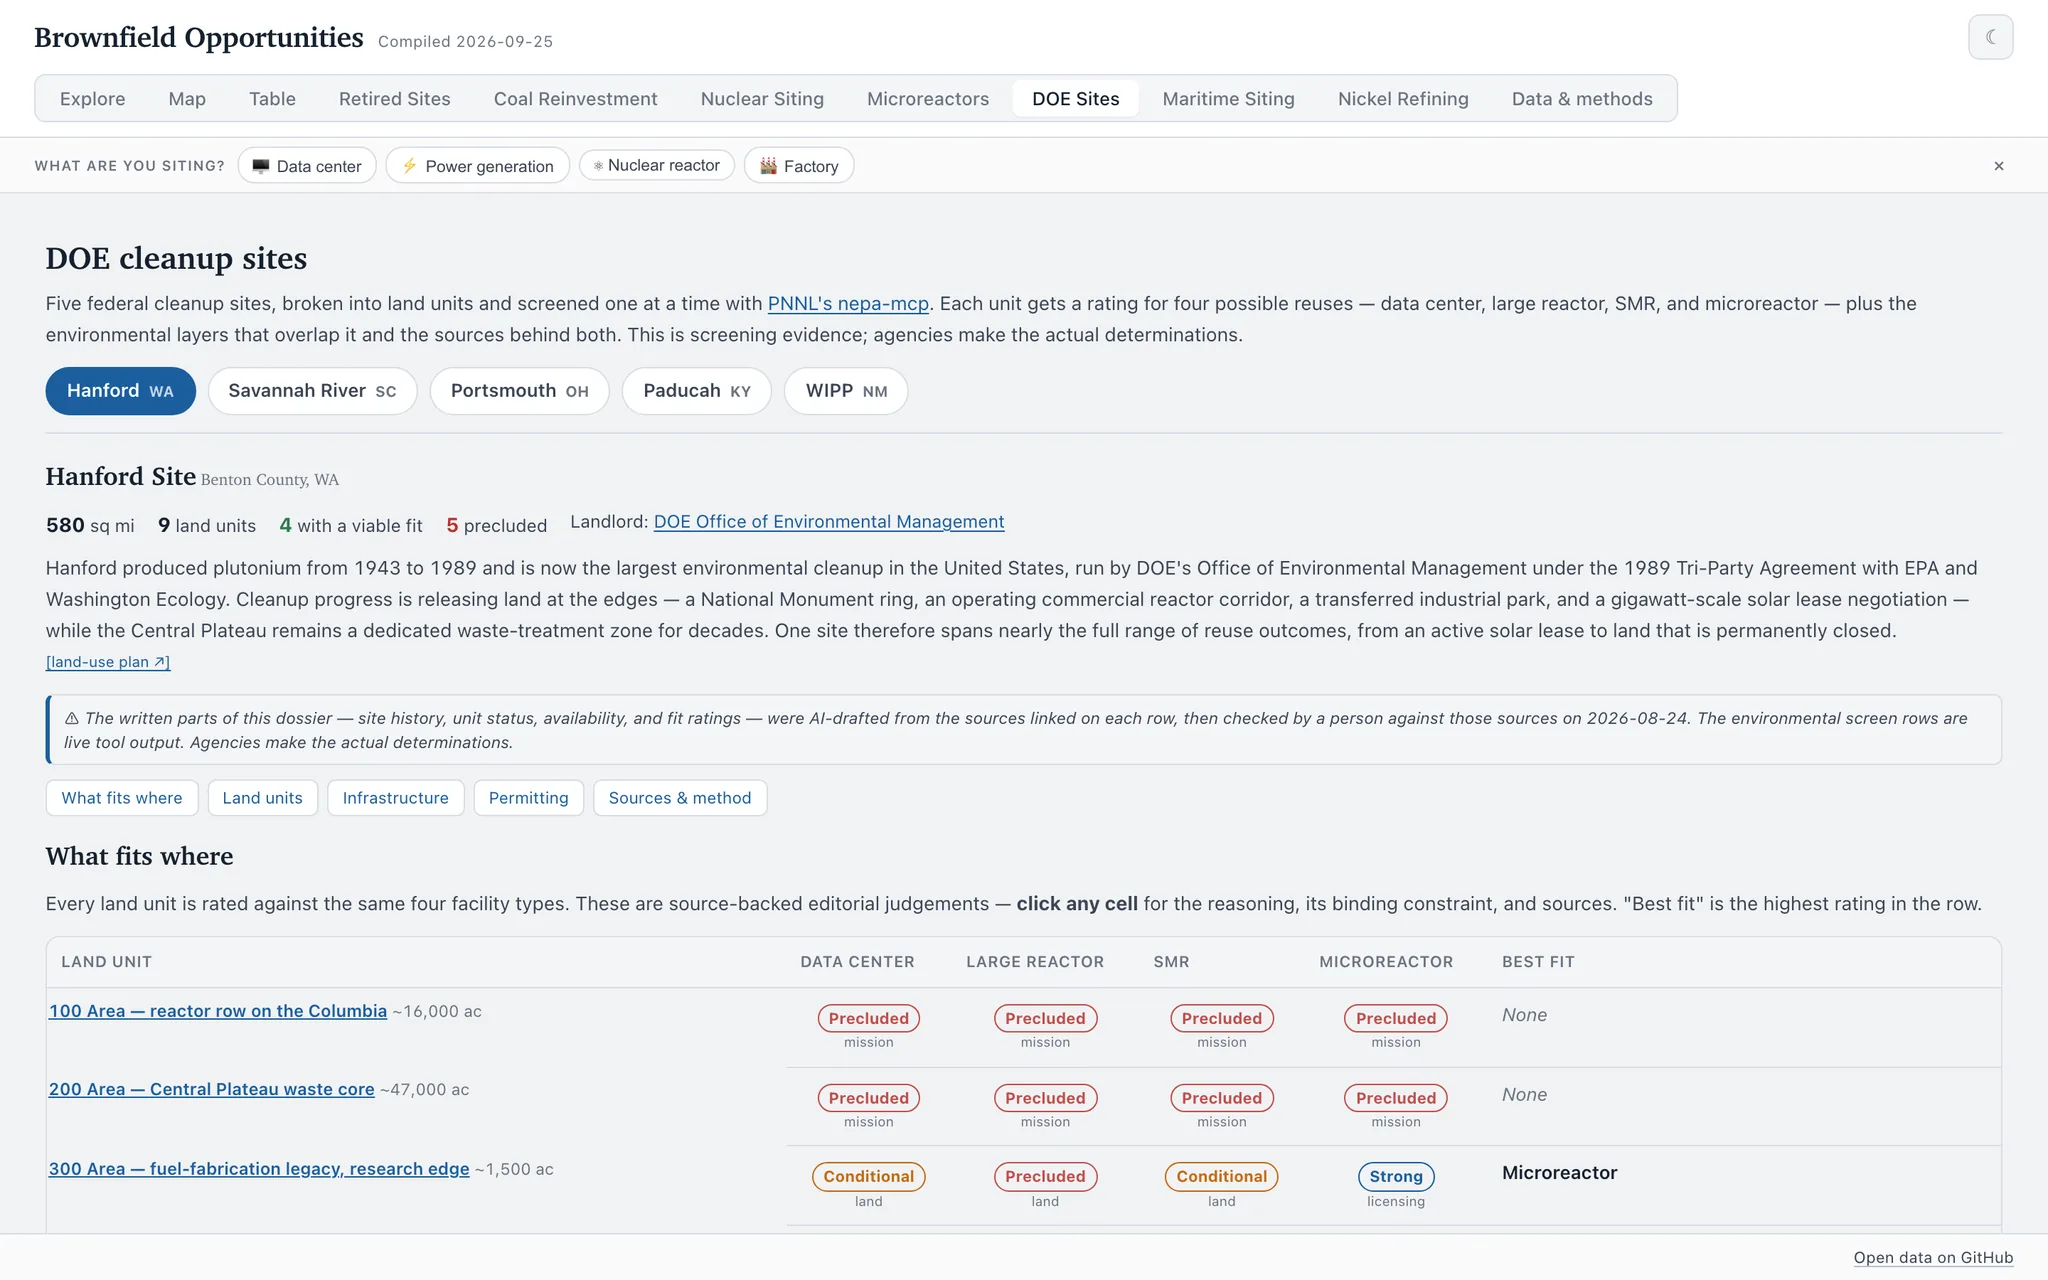
Each view shown on mobile and desktop — tap any image to open the live site.
How It Works
- Catalogs: EPA Superfund and ACRES, USACE FUDS and DOD BRAC records keep their program identities and source links.
- Evidence categories: Each finding states evidence, confidence and missing inputs. Unknown information does not improve a site’s position; there is no composite suitability score.
- Infrastructure: Mapped lines, substations, roads, rail and gages provide geographic context. They do not establish a connection, spare capacity, reliable supply or legal access.
- Environmental screening: Army, coal-plant and DOE land-unit screens use PNNL’s NEPA-MCP toolkit. Source-linked screening leaves determinations to the responsible agencies.
- Exploration: Search, program and state filters, CSV export, site links and a mobile detail sheet support inspection of the underlying records.
Scope reviewed October 2, 2026 · Project documentation. Source data keeps its published dates.