Data Center Water Usage
LIVE Measuring data-center water use against the public record
Background
The question that set this off: how much water do data centers actually use — and how much of that can you verify from the public record rather than a press release?
Water is the part of the data-center story that's easiest to hand-wave. Per-query estimates float around the internet and disagree by a factor of roughly 2,000, operators describe themselves as "water positive," and meanwhile the real numbers sit in permits, discharge reports, and enforcement files that nobody reads. I focused on Virginia and Ohio — two of the densest data-center markets in the country — and tried to put the claims and the records next to each other, so you can see where they line up and where they don't.
How It Works
Under the hood it's a Python scraping and extraction pipeline that pulls documents from public utility and environmental portals, then a dashboard that makes the result browsable:
- Where the data comes from: state utility and environmental portals in Virginia and Ohio, plus EPA's ECHO system for Clean Water Act discharge-monitoring reports and facility records by industry code.
- Getting numbers out of paper: dedicated extractors pull figures out of PDFs and Excel files, match water-related keywords, and tag the companies and facilities involved. A SQLite state database remembers every document it has already fetched, so re-runs skip what hasn't changed, and the data is append-only — newer filings win, nothing gets silently overwritten.
- Keeping it honest: every record carries the source URL it came from, scraping is throttled with polite delays so it never hammers a government server, and the whole thing is built to be re-run and audited rather than taken on faith.
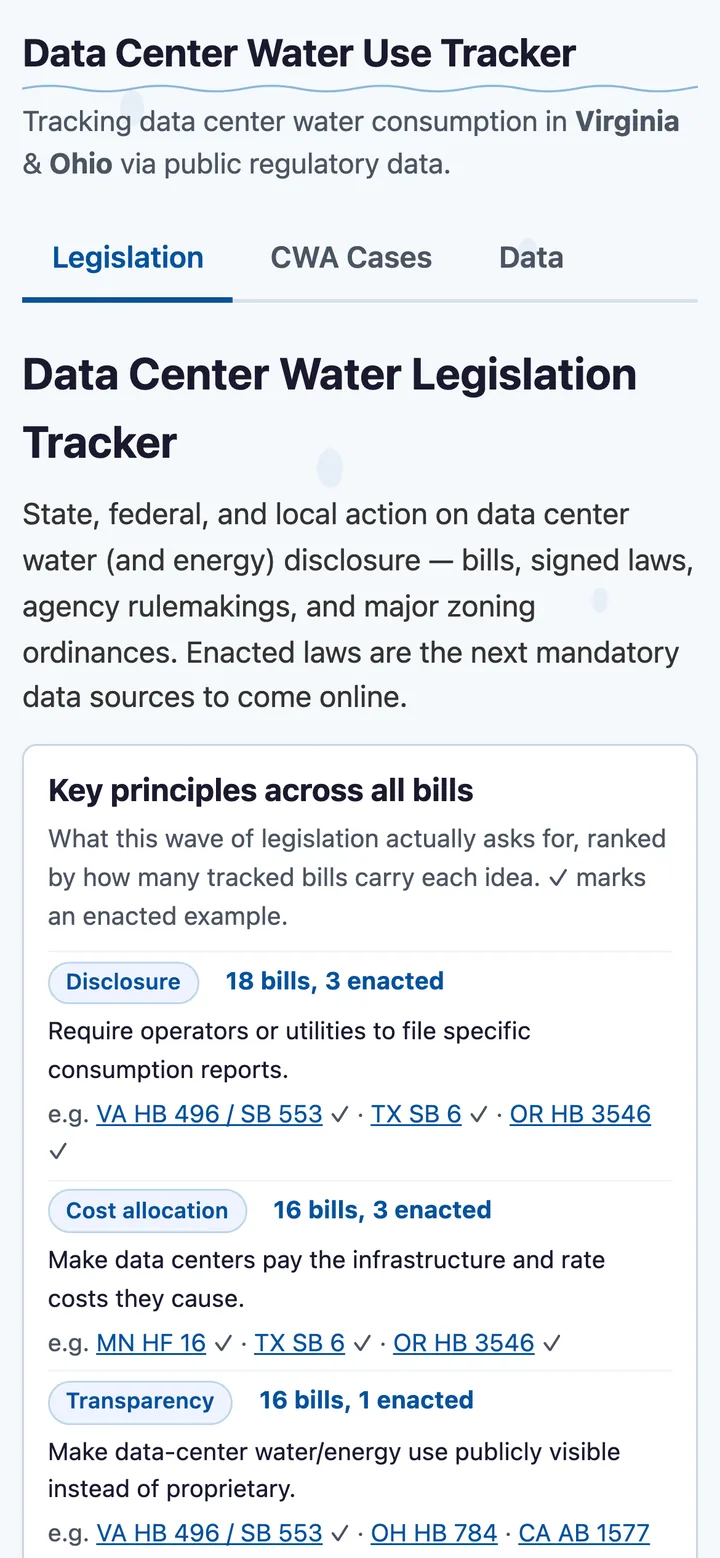
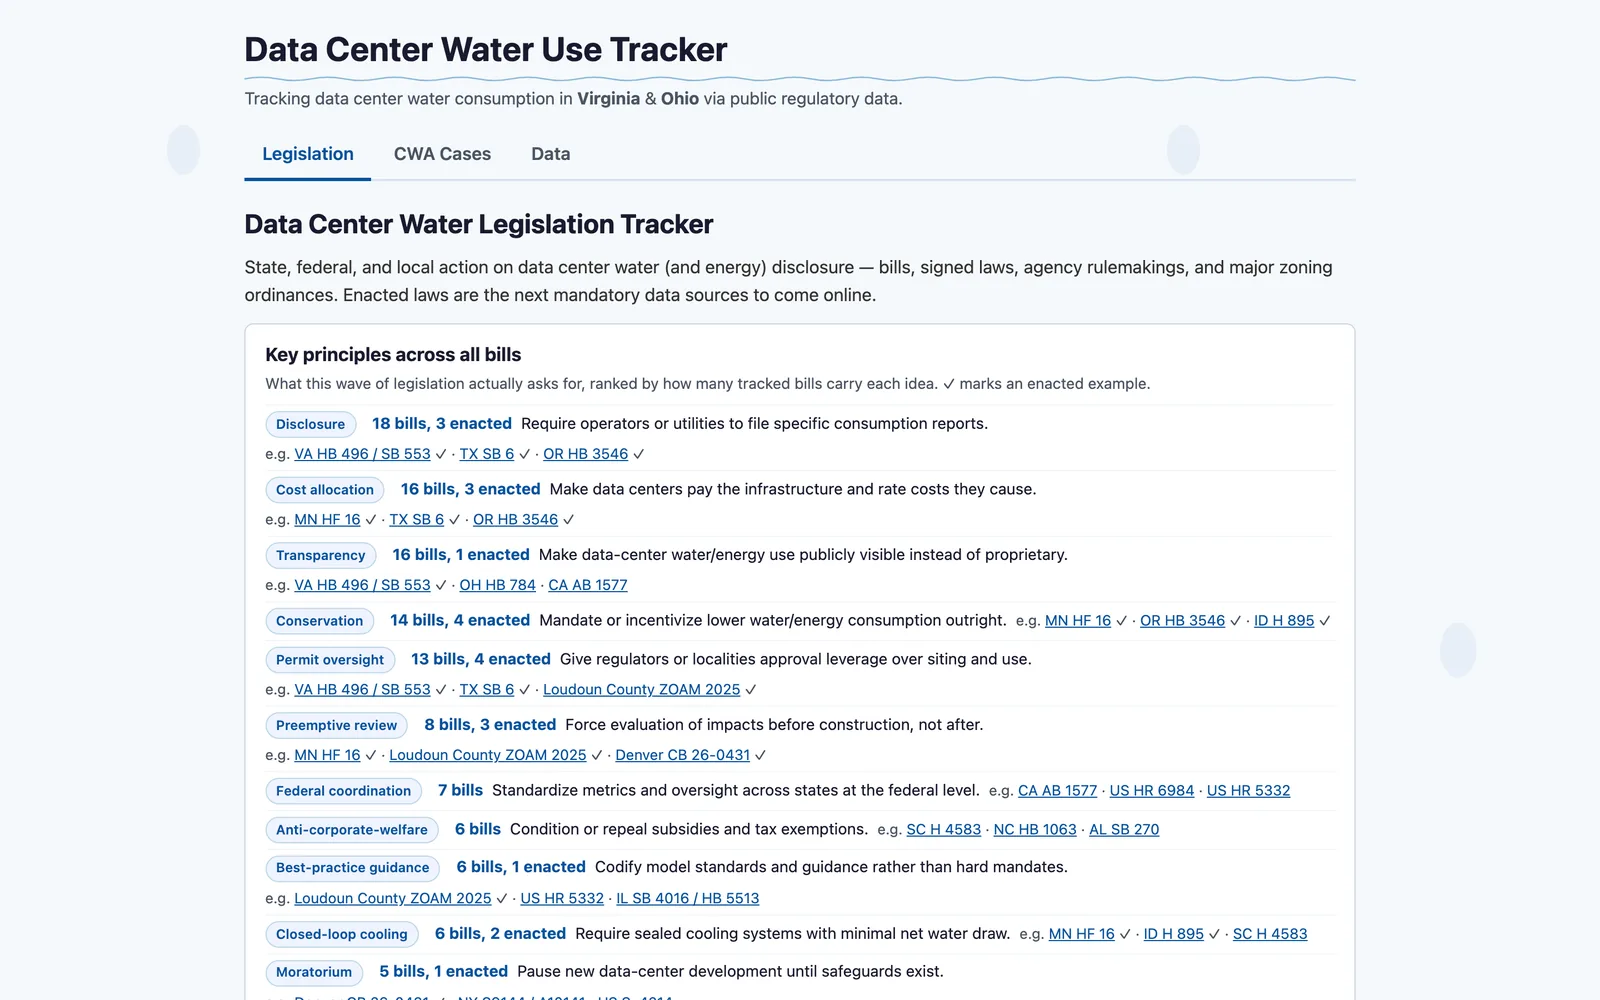
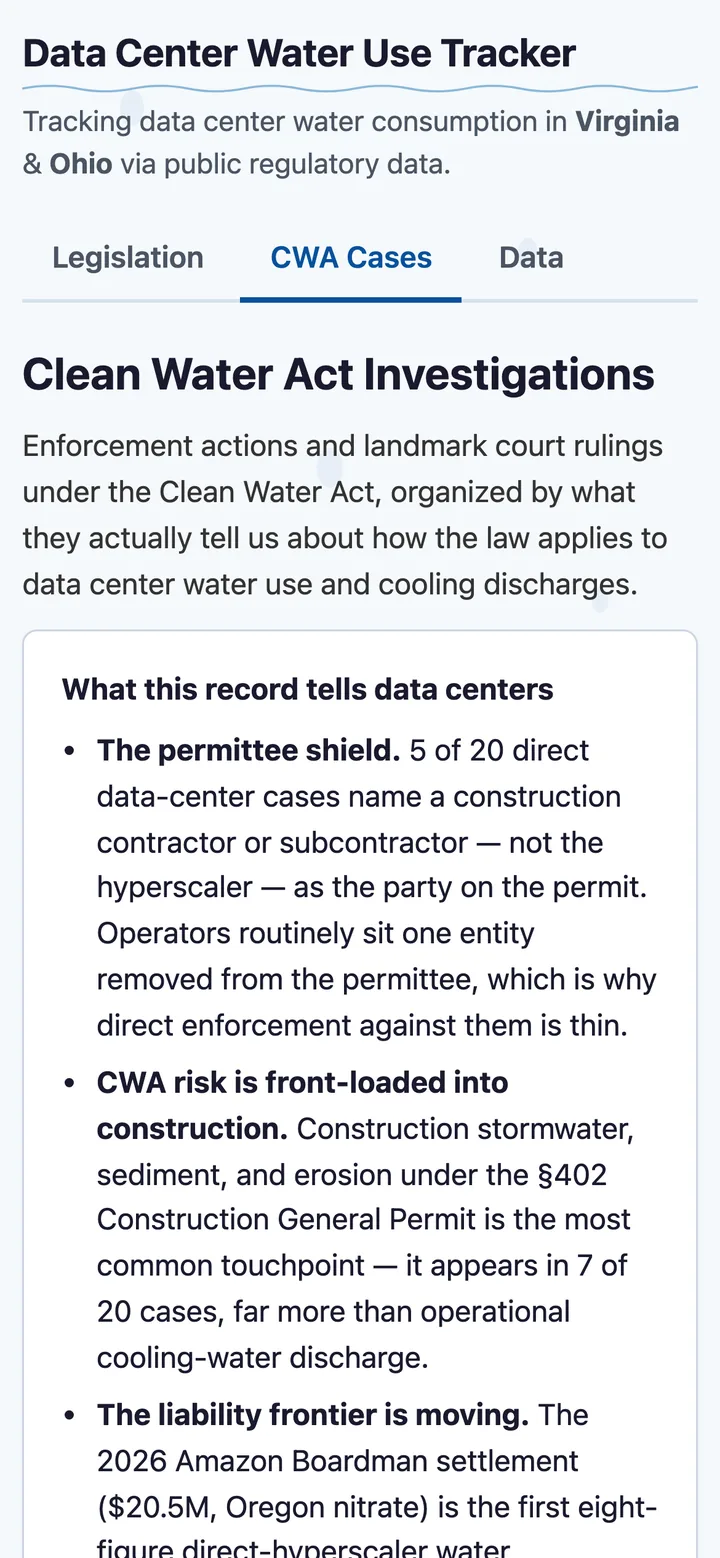
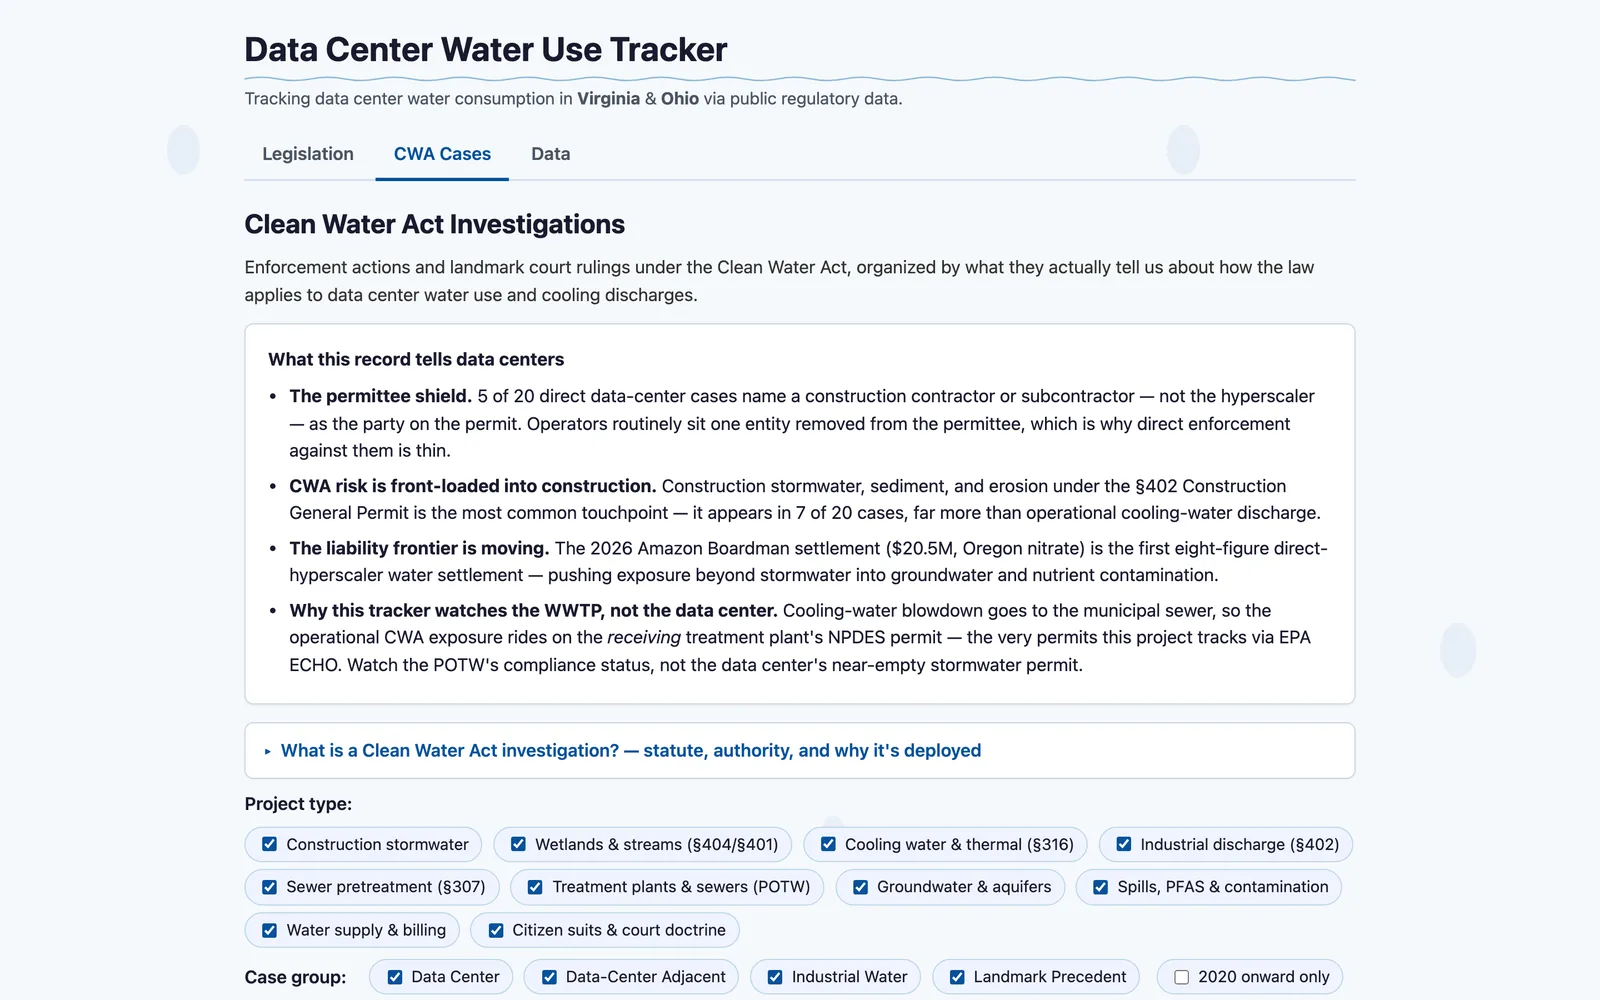
- What you see: three tabs — Legislation (state and federal water bills affecting data centers, color-coded by status), CWA Cases (Clean Water Act investigations and enforcement), and Data (the measurements) — plus a transparency scorecard, an explainer on why per-query estimates vary so wildly, and 29 verbatim water claims straight from operators.
- A heads-up on load time: the dashboard is a Streamlit app that runs entirely in your browser, so the first visit downloads a ~15 MB Python runtime and can take 30–40 seconds to spin up. After that it's cached and quick.
A Look Inside
Each view shown on mobile and desktop — tap any image to open the live site.