Background
The question I set out to answer: As trade policy and geopolitics shift, what do the fundamentals actually say about U.S. mineral supply and import reliance?
Critical minerals (gallium, germanium, the rare earths, cobalt, antimony, and dozens more) sit at the center of export controls, tariff fights, and reshoring debates. The authoritative reference is the U.S. Geological Survey's annual Mineral Commodity Summaries, but it ships as a stack of dense PDFs that's painful to read across commodities. My main use case is to quickly make sense of commodity information amid trade and geopolitical change: how reliant the U.S. is on imports for a given material (net import reliance), which countries those imports come from, and what the USGS itself flags under "Events, Trends & Issues", without losing the thread back to the official numbers.
How It Works
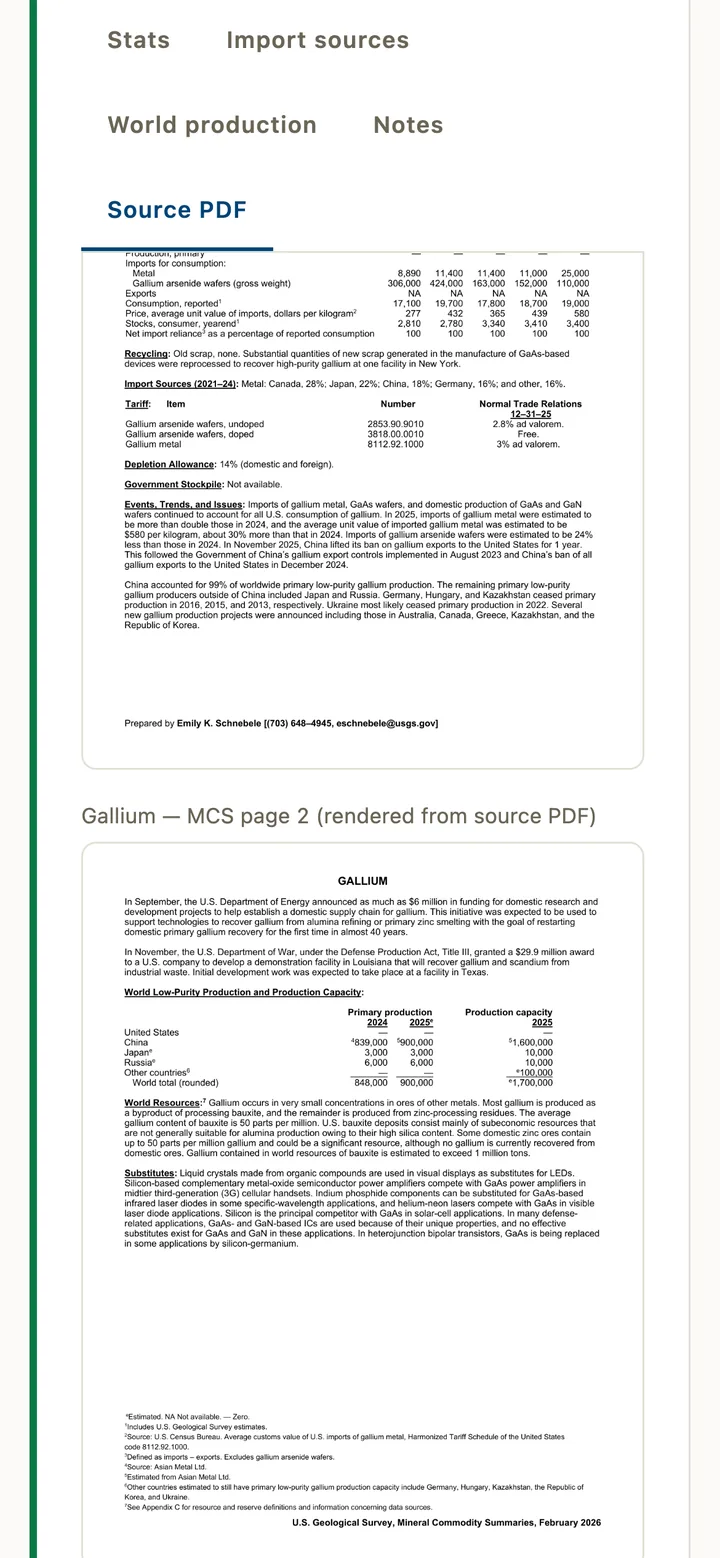
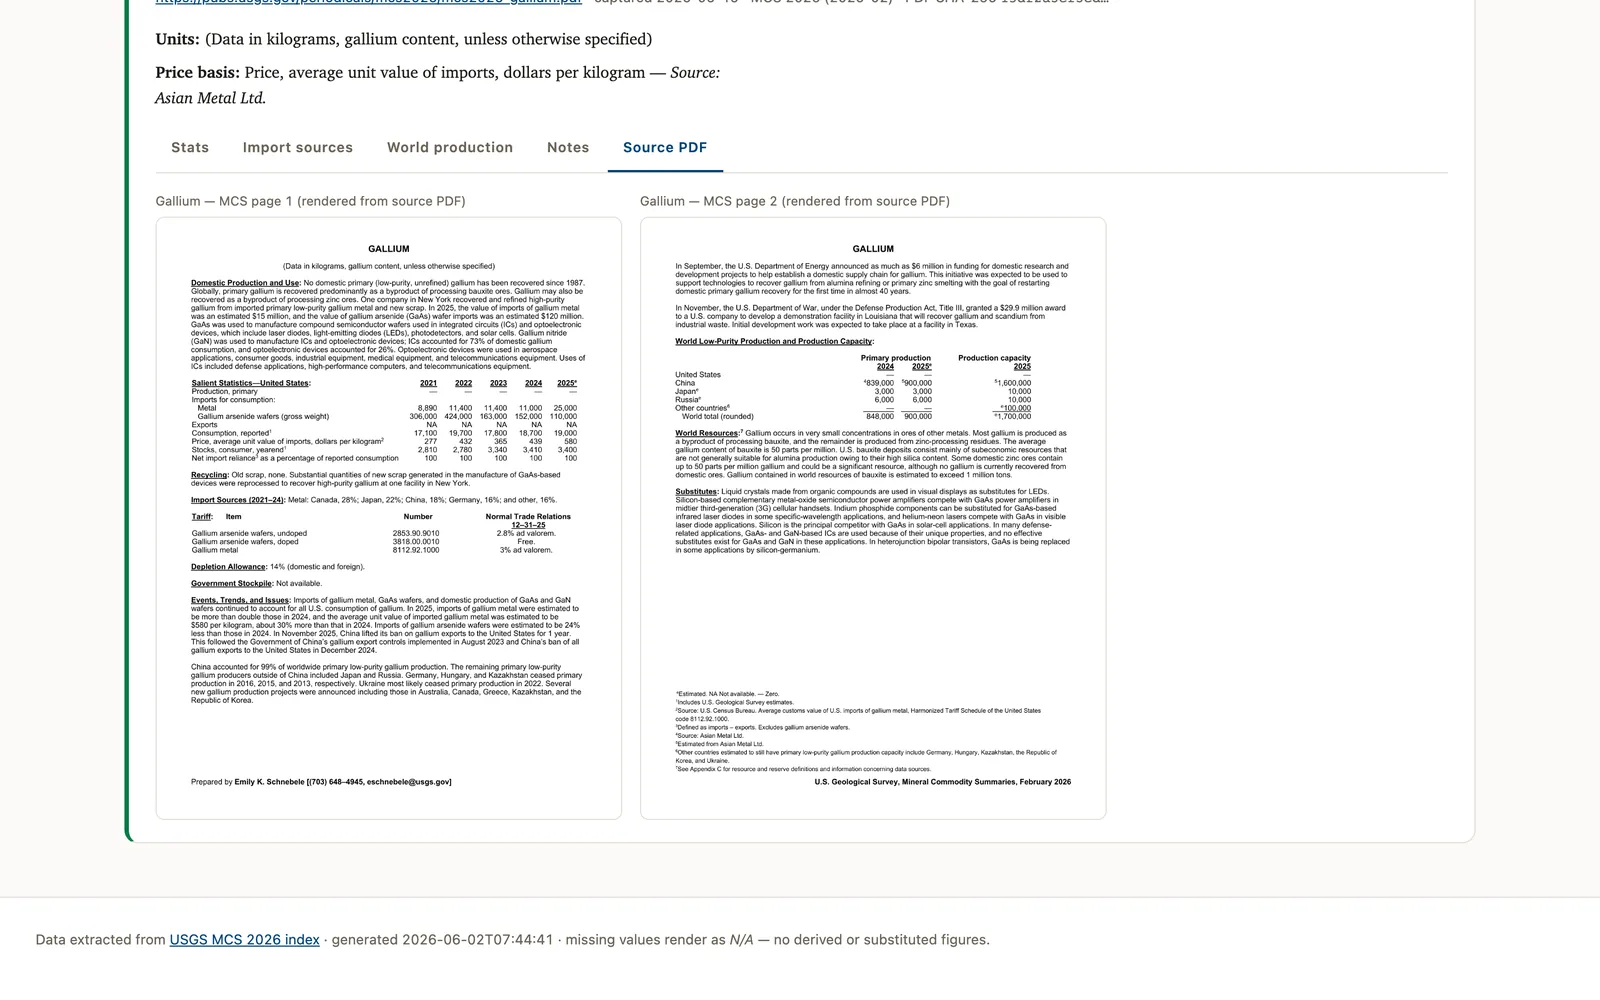
Every value links back to the exact page of the official PDF it came from. The tool surfaces what USGS published and doesn't add anything on top. I vibe-coded the extraction pipeline and then pinned it down with per-commodity regression tests so the parsing stays honest:
- Data sources: the official USGS Mineral Commodity Summaries (MCS 2026) PDFs (public-domain) covering ~50 commodities including all the critical-mineral headliners (lithium, rare earths, platinum-group metals, gallium, germanium, cobalt, antimony); a Python pipeline downloads each PDF (cached after first fetch) and extracts the salient-statistics tables (2021–2025 imports, exports, net import reliance %, price), import-sources-by-country, world production & reserves, the verbatim prose blocks, and every footnote, preserving units exactly as printed.
- Where it comes from: each record carries the source URL, the PDF's SHA-256 hash, and the capture date, and the viewer shows the source-PDF page screenshot inline so any number can be checked against the original.
- UX: a fast, static, sortable table with a category taxonomy (rare earths only, PGM only, etc.) and CSV export, deployed to GitHub Pages via Actions.
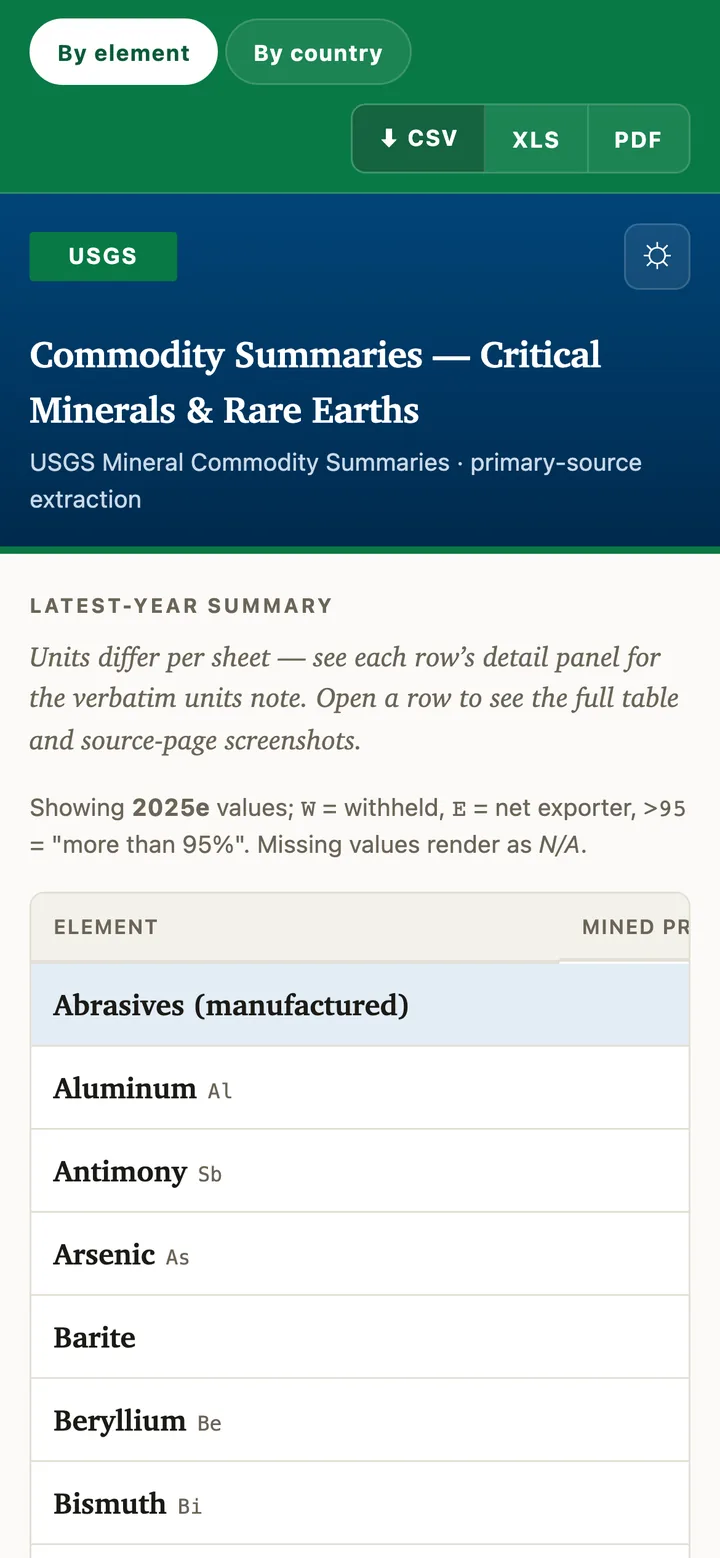
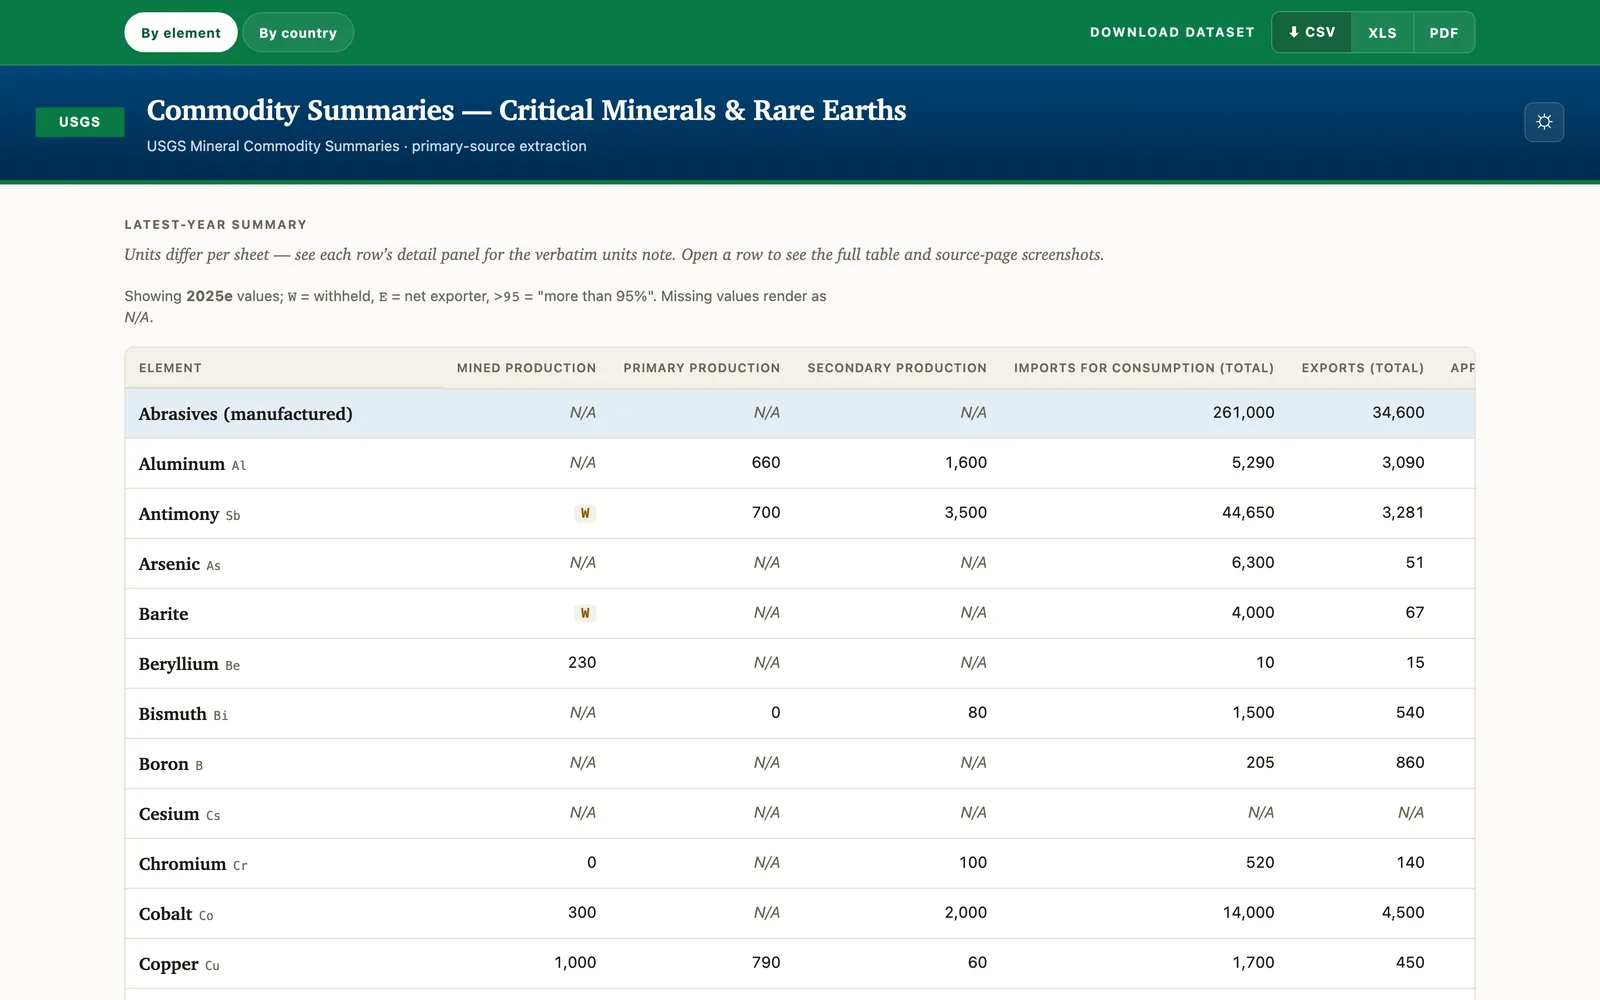
A Look Inside
Each view shown on mobile and desktop — tap any image to open the live site.