Microreactor Opportunity Map
Case study · Infrastructure
Who's Buying, Not Who's Announcing
- What
- 16 named buyers across three tracks, and 62 real-world prices a reactor has to beat — every figure cited.
- Stack
- Static HTML/CSS/JS, no framework; a multi-agent research pipeline gated by a citation-lock test suite.
- Status
- LIVE
- Dates
- Published August 2026
- Links
- Live site · Source code
Background
Who is actually buying microreactors, and how far has each buyer track moved from stated interest to a signed instrument?
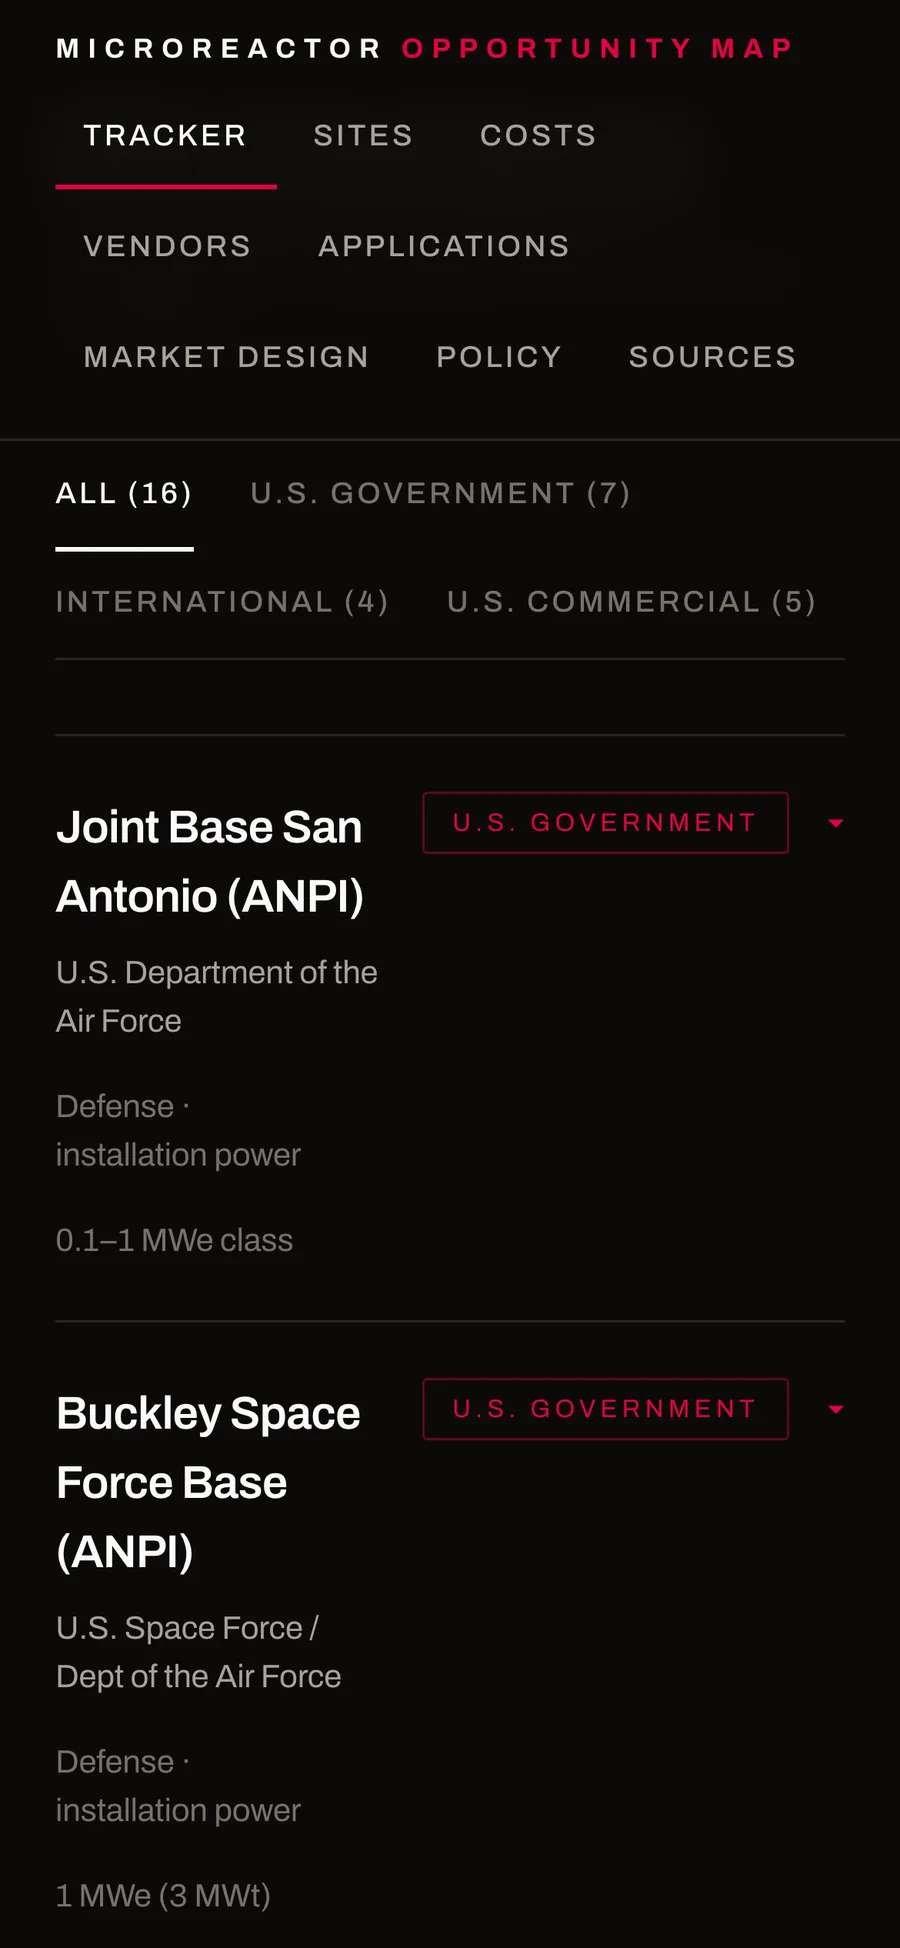
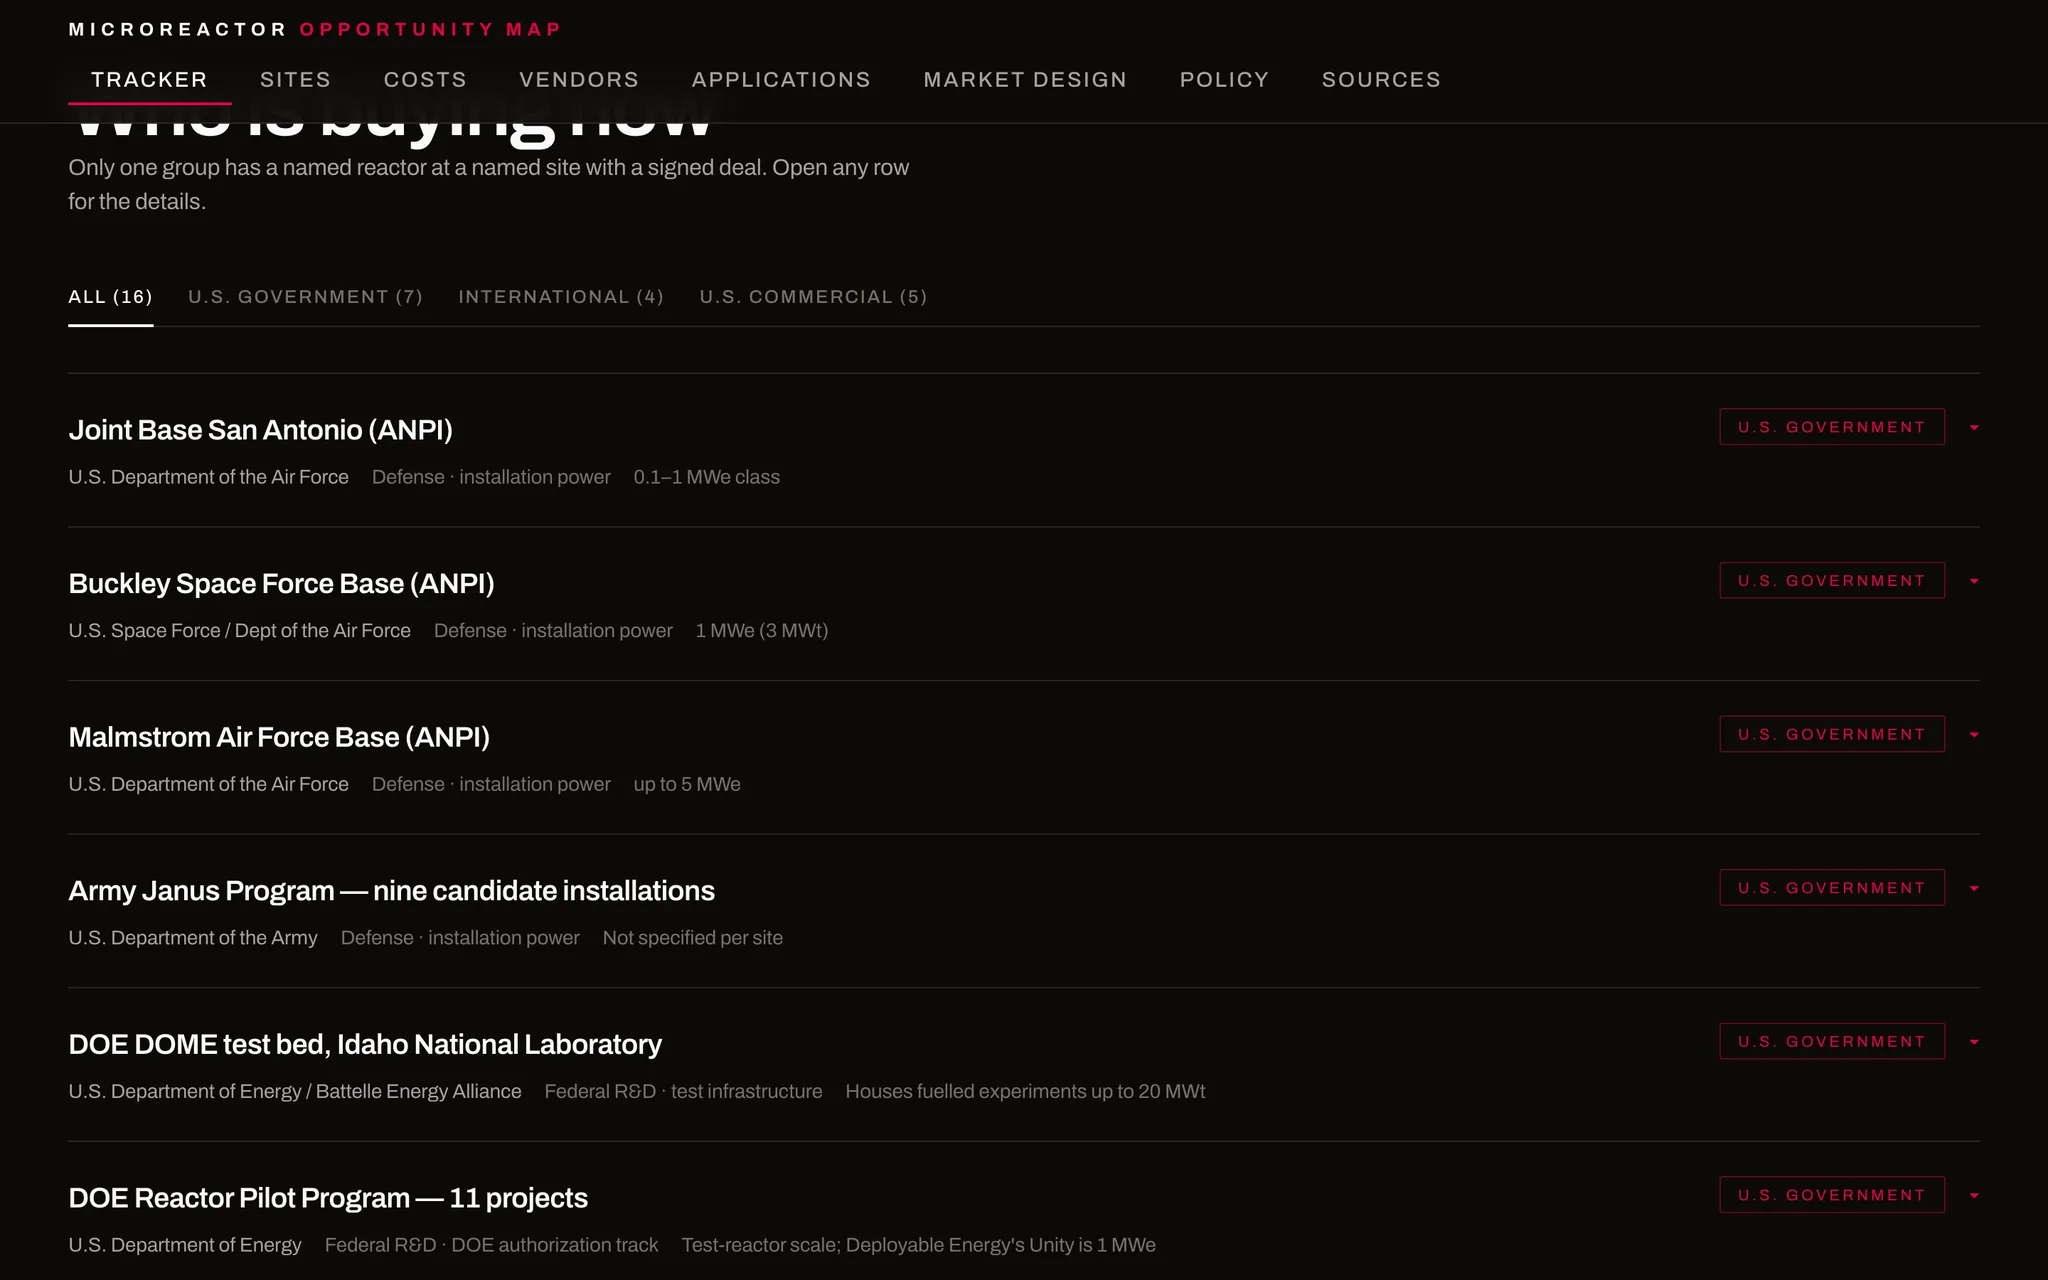
Every microreactor vendor has an "opportunity pipeline" slide, and most of them count the same handful of press releases twice. This site deliberately calls its buyer list a Tracker, not a pipeline — the World Nuclear Association's SMR project tracker is the naming model, while WoodMac's "pipeline" counts the whole announced market this site is not trying to be. The result is 16 named buyers sorted into three tracks — U.S. government, international, and U.S. commercial — ordered by how far each has actually moved, from a stated interest to a signed instrument. Nine hold one today; the rest are ranked candidly by how far they still have to go.
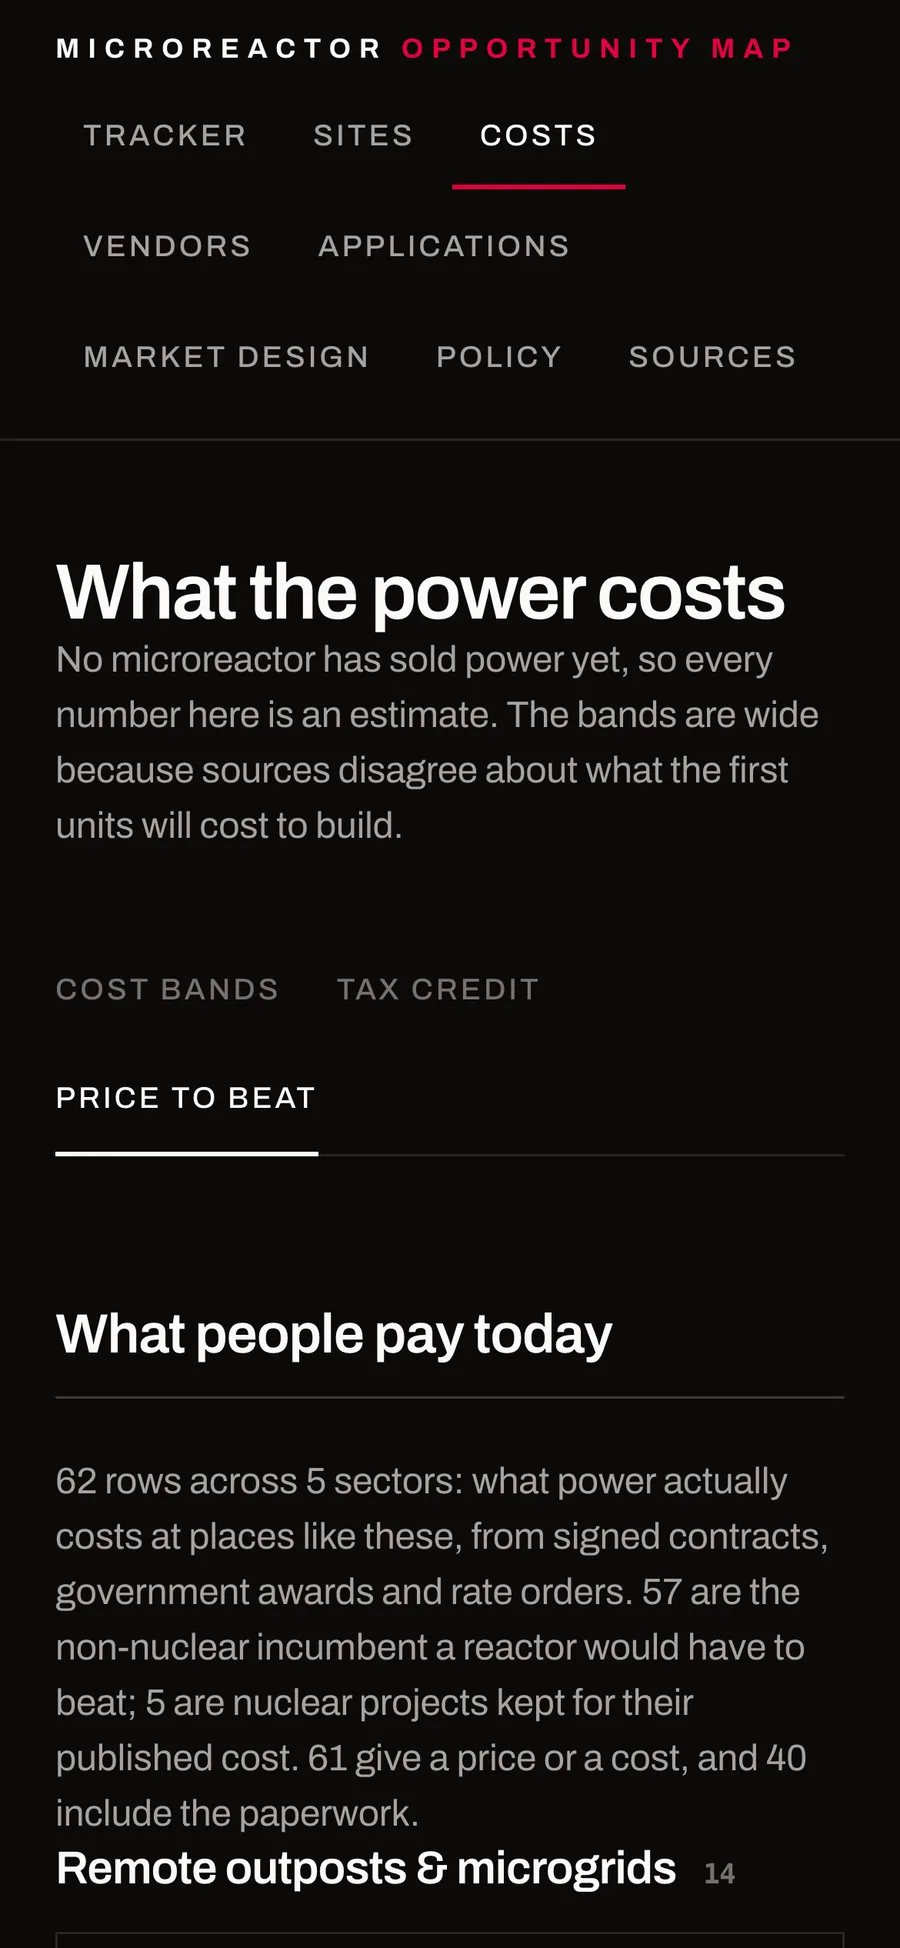
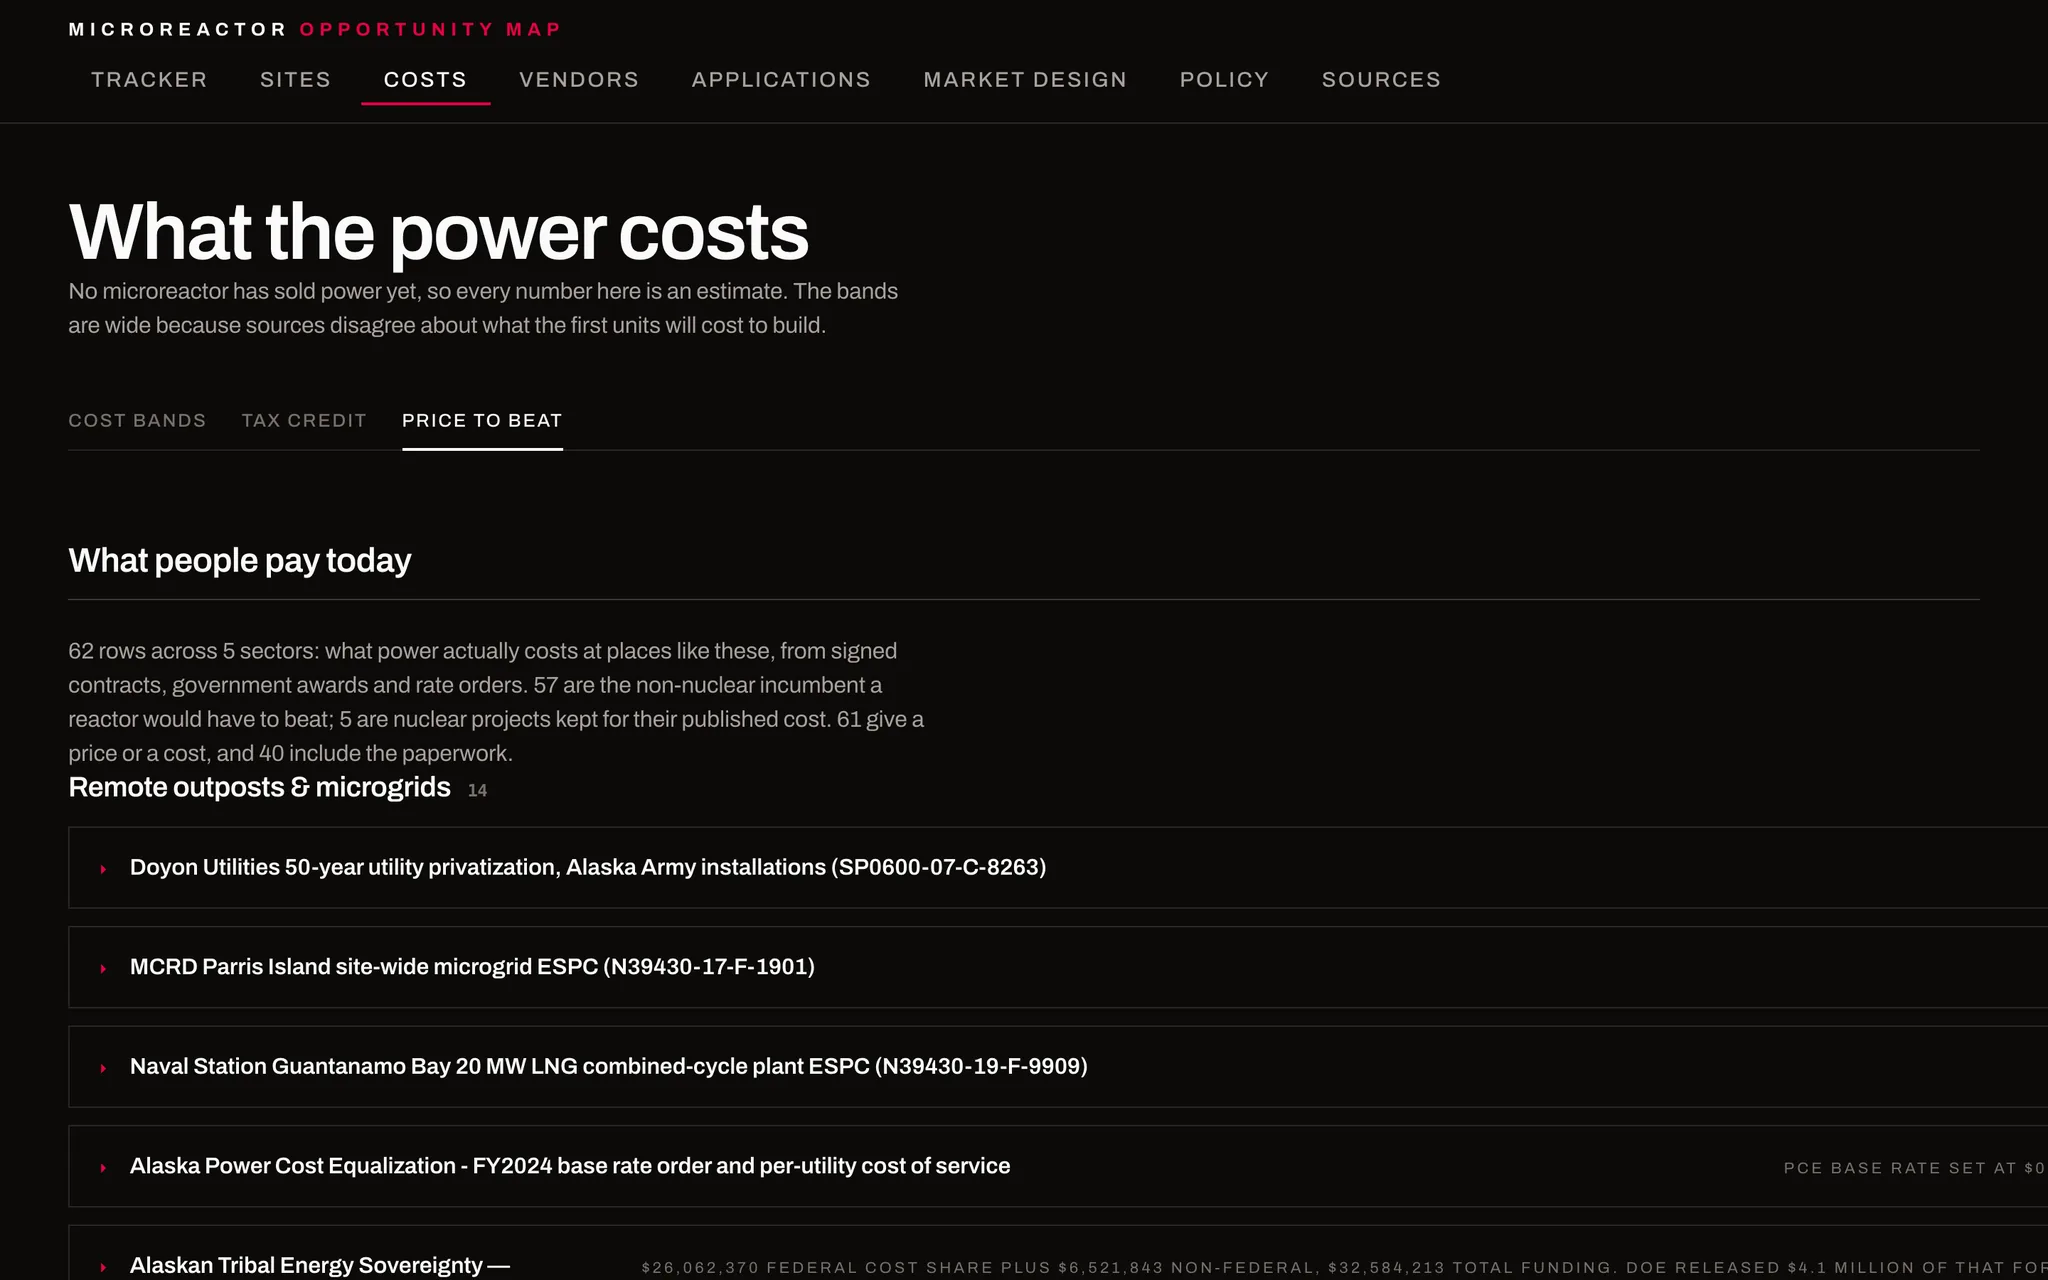
The site's other half asks a colder question: does the economics work? The Price to Beat feature answers it with 62 real prices — signed contracts, government awards, and rate orders across five sectors, from a 50-year Army microgrid privatization in Alaska to a state utility-commission rate order — set directly against published first-of-a-kind and nth-of-a-kind cost bands. Off-grid diesel replacement is the one market where the case isn't close; against the ordinary U.S. grid, a microreactor only wins in a scenario that assumes a tax credit no one has been paid yet.
A Look Inside
Each view shown on mobile and desktop — tap any image to open the live site.
How It Works
Most of the dataset is curated directly from primary sources; the instruments and price-to-beat tables are generated by a multi-agent research pipeline held to a citation contract before it ships:
- Research pipeline: a scaffold-validate-summarize loop (
research_pass.py) runs each pass against a written contract; the validator rejects bare-homepage sources, records with no number attached, missing precedents, duplicate IDs, and citations dated after their own source. - Docket-only sources: web search doesn't index NRC ADAMS or FERC's eLibrary, so purpose-built scrapers (
adams_search.py,ferc_elibrary.py) query them directly — including recording the negative result when a search comes back empty, rather than leaving the field blank. - Citation-lock tests: every source gets one number, reused everywhere it's cited; two tests fail the build if a citation renders
[?]or if the register and the page ever disagree on what a number points to. - Plain-language + AI-tell linting: authored prose is swept for the AI-writing tics that slip past a spell-checker — hedge-stacking, comma-staple headings, praising the tool's own honesty — with verbatim quotes and source titles exempted.
- Deterministic build: the site's "as of" date is derived from the data files' own metadata, never the wall clock, so CI can rebuild everything from source and fail on any drift from the committed output.